
Research · City vs city
City vs City: Google Review Benchmarks
How many Google reviews do the top 3 businesses hold in Bangalore, Delhi, Mumbai, Hyderabad, Chennai, Pune, Kolkata? Here is the comparison, category by category.
Key findings
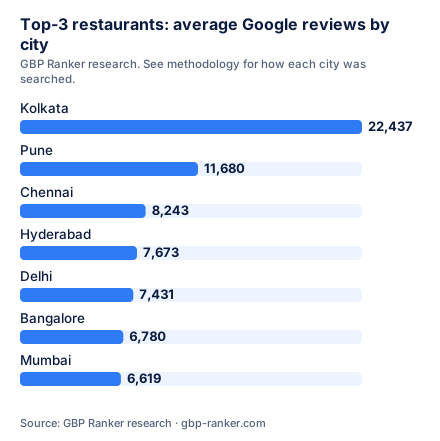
- Kolkata is the toughest city for restaurants: the top 3 average 22,437 Google reviews.
- Hyderabad is the toughest city for cafes: the top 3 average 5,615 Google reviews.
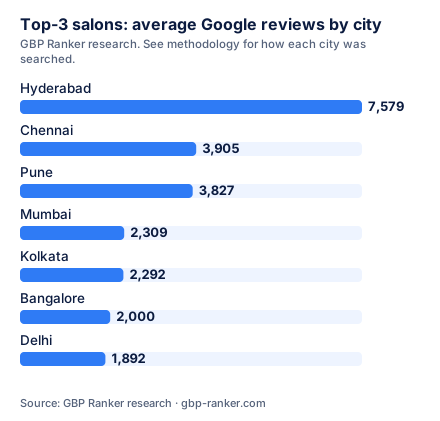
- Hyderabad is the toughest city for salons: the top 3 average 7,579 Google reviews.
- Mumbai is the toughest city for hotels: the top 3 average 14,210 Google reviews.
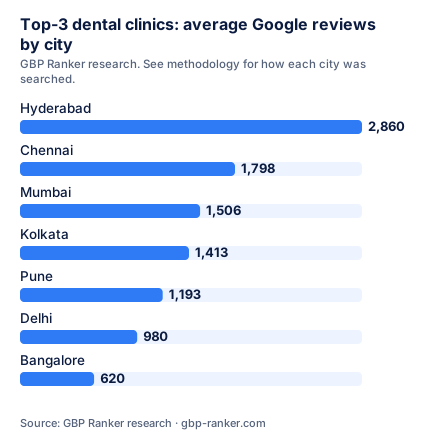
- Hyderabad is the toughest city for dental clinics: the top 3 average 2,860 Google reviews.
- Chennai is the toughest city for gyms: the top 3 average 1,753 Google reviews.
- Hyderabad is the toughest city for lawyers: the top 3 average 993 Google reviews.
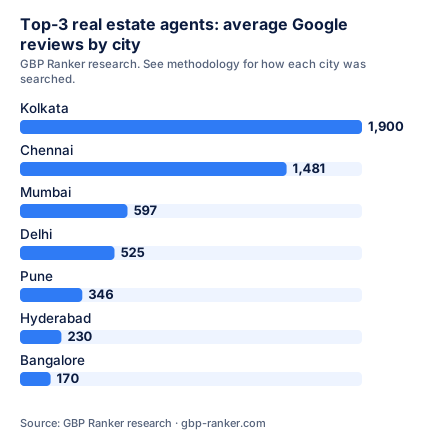
- Kolkata is the toughest city for real estate agents: the top 3 average 1,900 Google reviews.
- Hyderabad is the toughest city for car service: the top 3 average 1,248 Google reviews.
- Mumbai is the toughest city for pest control: the top 3 average 3,417 Google reviews.
All categories
| Top-3 avg reviews | Bangalore | Delhi | Mumbai | Hyderabad | Chennai | Pune | Kolkata |
|---|---|---|---|---|---|---|---|
| Restaurants | 6,780 | 7,431 | 6,619 | 7,673 | 8,243 | 11,680 | 22,437 |
| Cafes | 2,400 | 4,793 | 4,523 | 5,615 | 4,457 | 1,246 | 4,060 |
| Salons | 2,000 | 1,892 | 2,309 | 7,579 | 3,905 | 3,827 | 2,292 |
| Hotels | 2,000 | 11,214 | 14,210 | 2,921 | 1,756 | 11,308 | 2,278 |
| Dental clinics | 620 | 980 | 1,506 | 2,860 | 1,798 | 1,193 | 1,413 |
| Gyms | 580 | 651 | 913 | 901 | 1,753 | 608 | 801 |
| Lawyers | 360 | 493 | 739 | 993 | 689 | 603 | 956 |
| Real estate agents | 170 | 525 | 597 | 230 | 1,481 | 346 | 1,900 |
| Car service | 745 | 835 | 408 | 1,248 | 308 | 523 | 810 |
| Pest control | 460 | 884 | 3,417 | 583 | 2,596 | 1,251 | 1,225 |
Bold = toughest city for that category. Bangalore figures are averages of 40 area searches; Delhi, Mumbai and Hyderabad figures come from city-wide searches, so read them as rough benchmarks.
City studies
Where does your business rank in your city?
Get a free Google audit on WhatsApp: your rank and how you compare with your top 3 competitors.
Check my ranking freeFree. Takes about 2 minutes on WhatsApp. Or call +91 93802 30270 (Mon–Sat, 10 AM – 7 PM IST).
Cite this research
Journalists, bloggers and educators are welcome to use these figures. Please credit GBP Ranker with a link to this page.
Source: <a href="https://gbp-ranker.com/research/india-cities-google-reviews-comparison/">GBP Ranker, City vs City: Google Review Benchmarks in Bangalore, Delhi, Mumbai, Hyderabad, Chennai, Pune and Kolkata</a>Need a figure for a specific area, category or city? Email hello@gbp-ranker.com.
Questions
Which Indian city is hardest to rank in on Google Maps?
It depends on the category. In our research Kolkata is toughest for restaurants and Hyderabad for salons. See the table for every category.
Are these numbers comparable between cities?
Roughly. Bangalore figures average 40 area searches, while the other cities use city-wide searches. Use them as benchmarks, not exact targets.