Original research · Chennai
Chennai Google Maps & Review Statistics
From T Nagar to Anna Nagar and OMR, we searched Google Maps for 30 business types across Chennai. Here is how many Google reviews it takes to reach the top 3, and where it is hardest and easiest to win.
Key findings
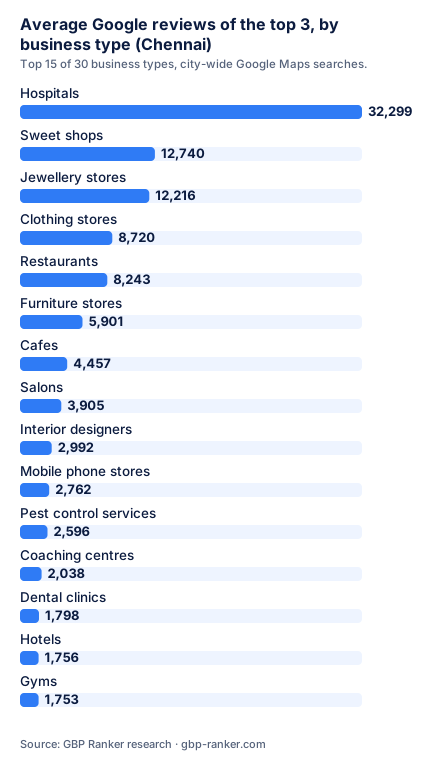
- The top 3 hospitals in Chennai average 32,299 Google reviews, the highest of the 30 business types we checked.
- Top-3 restaurants in Chennai average 8,243 Google reviews; a typical restaurant in the top 20 has 2,620.
- Top-3 cafes in Chennai average 4,457 Google reviews.
- Top-3 salons in Chennai average 3,905 Google reviews.
- Top-3 hotels in Chennai average 1,756 Google reviews.
- Top-3 gyms in Chennai average 1,753 Google reviews.
- Top-3 lawyers in Chennai average 689 Google reviews.
- Top-3 real estate agents in Chennai average 1,481 Google reviews.
- Top-3 dental clinics in Chennai average 1,798 reviews and a 4.9★ rating.
- Preschools have the lowest bar: the top 3 average only 283 Google reviews.
- 14 of 20 schools in the top Google Maps results have fewer than 100 reviews, the most open category in Chennai.
- The biggest gap is among interior designers: the top 3 have about 12× the reviews of a typical one (2,992 vs 252).
- Hotels have the lowest average rating in Chennai (4.3★).
- Of the 2 Chennai areas with detailed data, T Nagar is the toughest for restaurants (top 3 average 10,148 reviews) and Anna Nagar the easiest (8,810).
- At area level, 65% of real estate agents in the top results have fewer than 100 Google reviews.
- Our Chennai research covers 30 business types city-wide and 25 areas, using the top 20 Google Maps results of each search.
All figures are rough benchmarks from our research. Google Maps results change over time and differ slightly by where you search from.
Reviews held by the top 3, by business type
| Business type | Top-3 avg reviews | Typical business | Avg rating | Under 100 reviews |
|---|---|---|---|---|
| Hospitals | 32,299 | 5,395 | 4.7★ | 0 of 20 |
| Sweet shops | 12,740 | 3,589 | 4.4★ | 0 of 20 |
| Jewellery stores | 12,216 | 2,809 | 4.8★ | 0 of 20 |
| Clothing stores | 8,720 | 2,738 | 4.5★ | 0 of 20 |
| Restaurants | 8,243 | 2,620 | 4.5★ | 0 of 20 |
| Furniture stores | 5,901 | 1,023 | 4.5★ | 0 of 20 |
| Cafes | 4,457 | 2,335 | 4.4★ | 0 of 20 |
| Salons | 3,905 | 3,379 | 4.8★ | 0 of 20 |
| Interior designers | 2,992 | 252 | 4.8★ | 0 of 20 |
| Mobile phone stores | 2,762 | 2,800 | 4.8★ | 0 of 20 |
| Pest control services | 2,596 | 291 | 4.9★ | 2 of 20 |
| Coaching centres | 2,038 | 518 | 4.6★ | 0 of 20 |
| Dental clinics | 1,798 | 1,094 | 4.9★ | 0 of 20 |
| Hotels | 1,756 | 1,612 | 4.3★ | 0 of 20 |
| Gyms | 1,753 | 520 | 4.9★ | 0 of 20 |
| Real estate agents | 1,481 | 176 | 4.9★ | 3 of 20 |
| Bakerys | 1,409 | 1,183 | 4.6★ | 0 of 20 |
| Veterinary clinics | 1,163 | 593 | 4.5★ | 0 of 20 |
| Spas | 1,090 | 361 | 4.8★ | 2 of 20 |
| Dermatologists | 1,009 | 543 | 4.7★ | 0 of 20 |
| Bike service centres | 721 | 111 | 4.7★ | 8 of 20 |
| Lawyers | 689 | 152 | 4.8★ | 7 of 20 |
| Physiotherapists | 566 | 459 | 4.9★ | 0 of 20 |
| Electricians | 503 | 138 | 4.9★ | 5 of 20 |
| Yoga studios | 387 | 165 | 4.9★ | 2 of 20 |
| Plumbers | 335 | 117 | 4.8★ | 6 of 20 |
| Schools | 333 | – | 4.5★ | 14 of 20 |
| Chartered accountants | 321 | 60 | 4.9★ | 11 of 20 |
| Car service centres | 308 | 341 | 4.7★ | 2 of 20 |
| Preschools | 283 | 194 | 4.9★ | 1 of 20 |
Area by area
Detailed figures for the 2 Chennai areas published so far. More areas are added as each area page goes live.
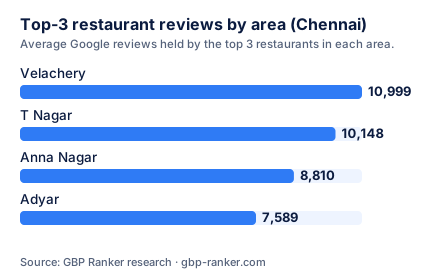
T Nagar
| Business type | Top-3 avg reviews | Typical business | Avg rating | Under 100 reviews |
|---|---|---|---|---|
| Restaurants | 10,148 | 2,614 | 4.4★ | 0 of 20 |
| Salons | 3,454 | 1,176 | 4.8★ | 1 of 20 |
| Real estate agents | 922 | 55 | 4.7★ | 12 of 20 |
| Gyms | 509 | 186 | 4.6★ | 6 of 20 |
| Dental clinics | 379 | 144 | 4.9★ | 7 of 20 |
Anna Nagar
| Business type | Top-3 avg reviews | Typical business | Avg rating | Under 100 reviews |
|---|---|---|---|---|
| Restaurants | 8,810 | 4,507 | 4.4★ | 0 of 20 |
| Salons | 3,704 | 2,224 | 4.8★ | 0 of 20 |
| Dental clinics | 956 | 197 | 4.9★ | 0 of 20 |
| Gyms | 598 | 304 | 4.7★ | 3 of 20 |
| Real estate agents | 95 | 39 | 4.7★ | 14 of 20 |
What this means for Chennai businesses
- Your real competition is the top 3 for your category in your own area, not the whole city.
- Food, jewellery, hospitals and sweet shops are crowded: the top 3 have collected reviews for years.
- Professional and home services (lawyers, CAs, plumbers, electricians, real estate) are far more open.
- Reviews are one factor. The right category, accurate details, photos and regular activity matter too.
Where does your Chennai business rank?
Get a free Google audit on WhatsApp: your rank in your area and city, and how you compare with your top 3 competitors.
Check my ranking freeFree. Takes about 2 minutes on WhatsApp. Or call +91 93802 30270 (Mon–Sat, 10 AM – 7 PM IST).
Cite this research
Journalists, bloggers and educators are welcome to use these figures. Please credit GBP Ranker with a link to this page.
Source: <a href="https://gbp-ranker.com/research/chennai-google-maps-statistics/">GBP Ranker, Chennai Google Maps & Review Statistics</a>Need a figure for a specific area, category or city? Email hello@gbp-ranker.com.
Questions
How many Google reviews does a business need in Chennai?
It depends on the category. In our research the top 3 restaurants in Chennai average 8,243 Google reviews, while the top 3 preschools average only 283.
Which categories are easiest to rank in Chennai?
Categories where the top 3 hold few reviews and many businesses have under 100, such as preschools, real estate agents and plumbers. A complete profile and steady genuine reviews can stand out there.
Where does this data come from?
From Google Maps searches GBP Ranker ran for 30 business types across Chennai, plus area searches, recording the top 20 results of each search.
Can I use these figures?
Yes. Please credit GBP Ranker with a link to this page.